
Описание

ServerPulse is your **all-in-one** server **monitoring** solution that combines **powerful** metrics collection, beautiful **visualizations**, real-time **alerting**, and **effortless** setup. Monitor **TPS, memory, entities, and more** through professional Grafana **dashboards** - all up and **running in minutes** with Docker!
Tired of guessing why your server is **lagging**? Frustrated with complex monitoring setups? **ServerPulse** is what you are looking for!
If you need support, or you have any question, join our [Discord server](https://discord.gg/jZUqcemc4G)
## Why ServerPulse?
- **Zero-Configuration Monitoring:** Get started in minutes with our Docker Compose setup - InfluxDB, Grafana, and pre-built dashboards, all ready to go!
- **Universal Platform Support:** Works with any **Bukkit-based, Velocity, BungeeCord** and **Fabric** server while taking advantage of Paper-specific optimizations when available
- **Complete Solution:** Not just a metrics exporter - includes the entire monitoring stack optimized for time-series data
- **Per-World Performance Tracking:** Uniquely monitor metrics separately for each world - find problem areas fast!
- **Advanced Tagging System:** Group and filter metrics by server, network, region, or any custom dimension
- **Production-Ready Infrastructure:** Built-in health checks, automatic reconnection, and proper error handling
## Real-Time Metrics Include:
- TPS (1m, 5m, 15m)
- MSPT (last, min, max, 1m, 5m, 15m)
- CPU Usage (System, JVM, Available Processors)
- Online Players
- Player Ping Statistics (min, max, avg)
- JVM Memory (Used, Committed, Max Heap)
- Disk Usage (Usable Bytes & Percent)
- Per-World Stats:
- Loaded Chunks
- Total Entities
## Alert Notification System:
- **Multi-Platform Support:** Choose between Discord or Telegram for notifications
- **Instant Notifications:** Get alerted when TPS drops, memory spikes, or other
critical events occur
- **Customizable Thresholds:** Set your own alert conditions for any metric
- **Intelligent Alert Grouping:** Prevents notification spam during ongoing issues
- **Easy Integration:** Simple webhook setup for Discord or bot configuration for
Telegram
## Technical Features:
- **Efficient & Safe**: Asynchronous tasks and batch writing minimize performance
impact
- **Platform Detection**: Automatically detects your server type and uses the optimal implementation
- **Flexible Configuration**: Customize metrics collection intervals, alerts, and
tagging
- **Professional Dashboards**: Start monitoring immediately with pre-designed Grafana
dashboards
- **Open Source**: Full transparency and community-driven development
## Requirements:
- **Server**: Any Bukkit-based, Velocity, BungeeCord or Fabric server (Bukkit, Spigot, Paper, or forks like Purpur, Pufferfish)
- **System**: Docker and Docker Compose for the monitoring stack
- Optional: Discord server or Telegram bot for alert notifications
## Quick Start:
Clone, compose up, and you're monitoring! Full setup guide at [https://github.com/renvins/serverpulse](https://github.com/renvins/serverpulse)
Screenshots:
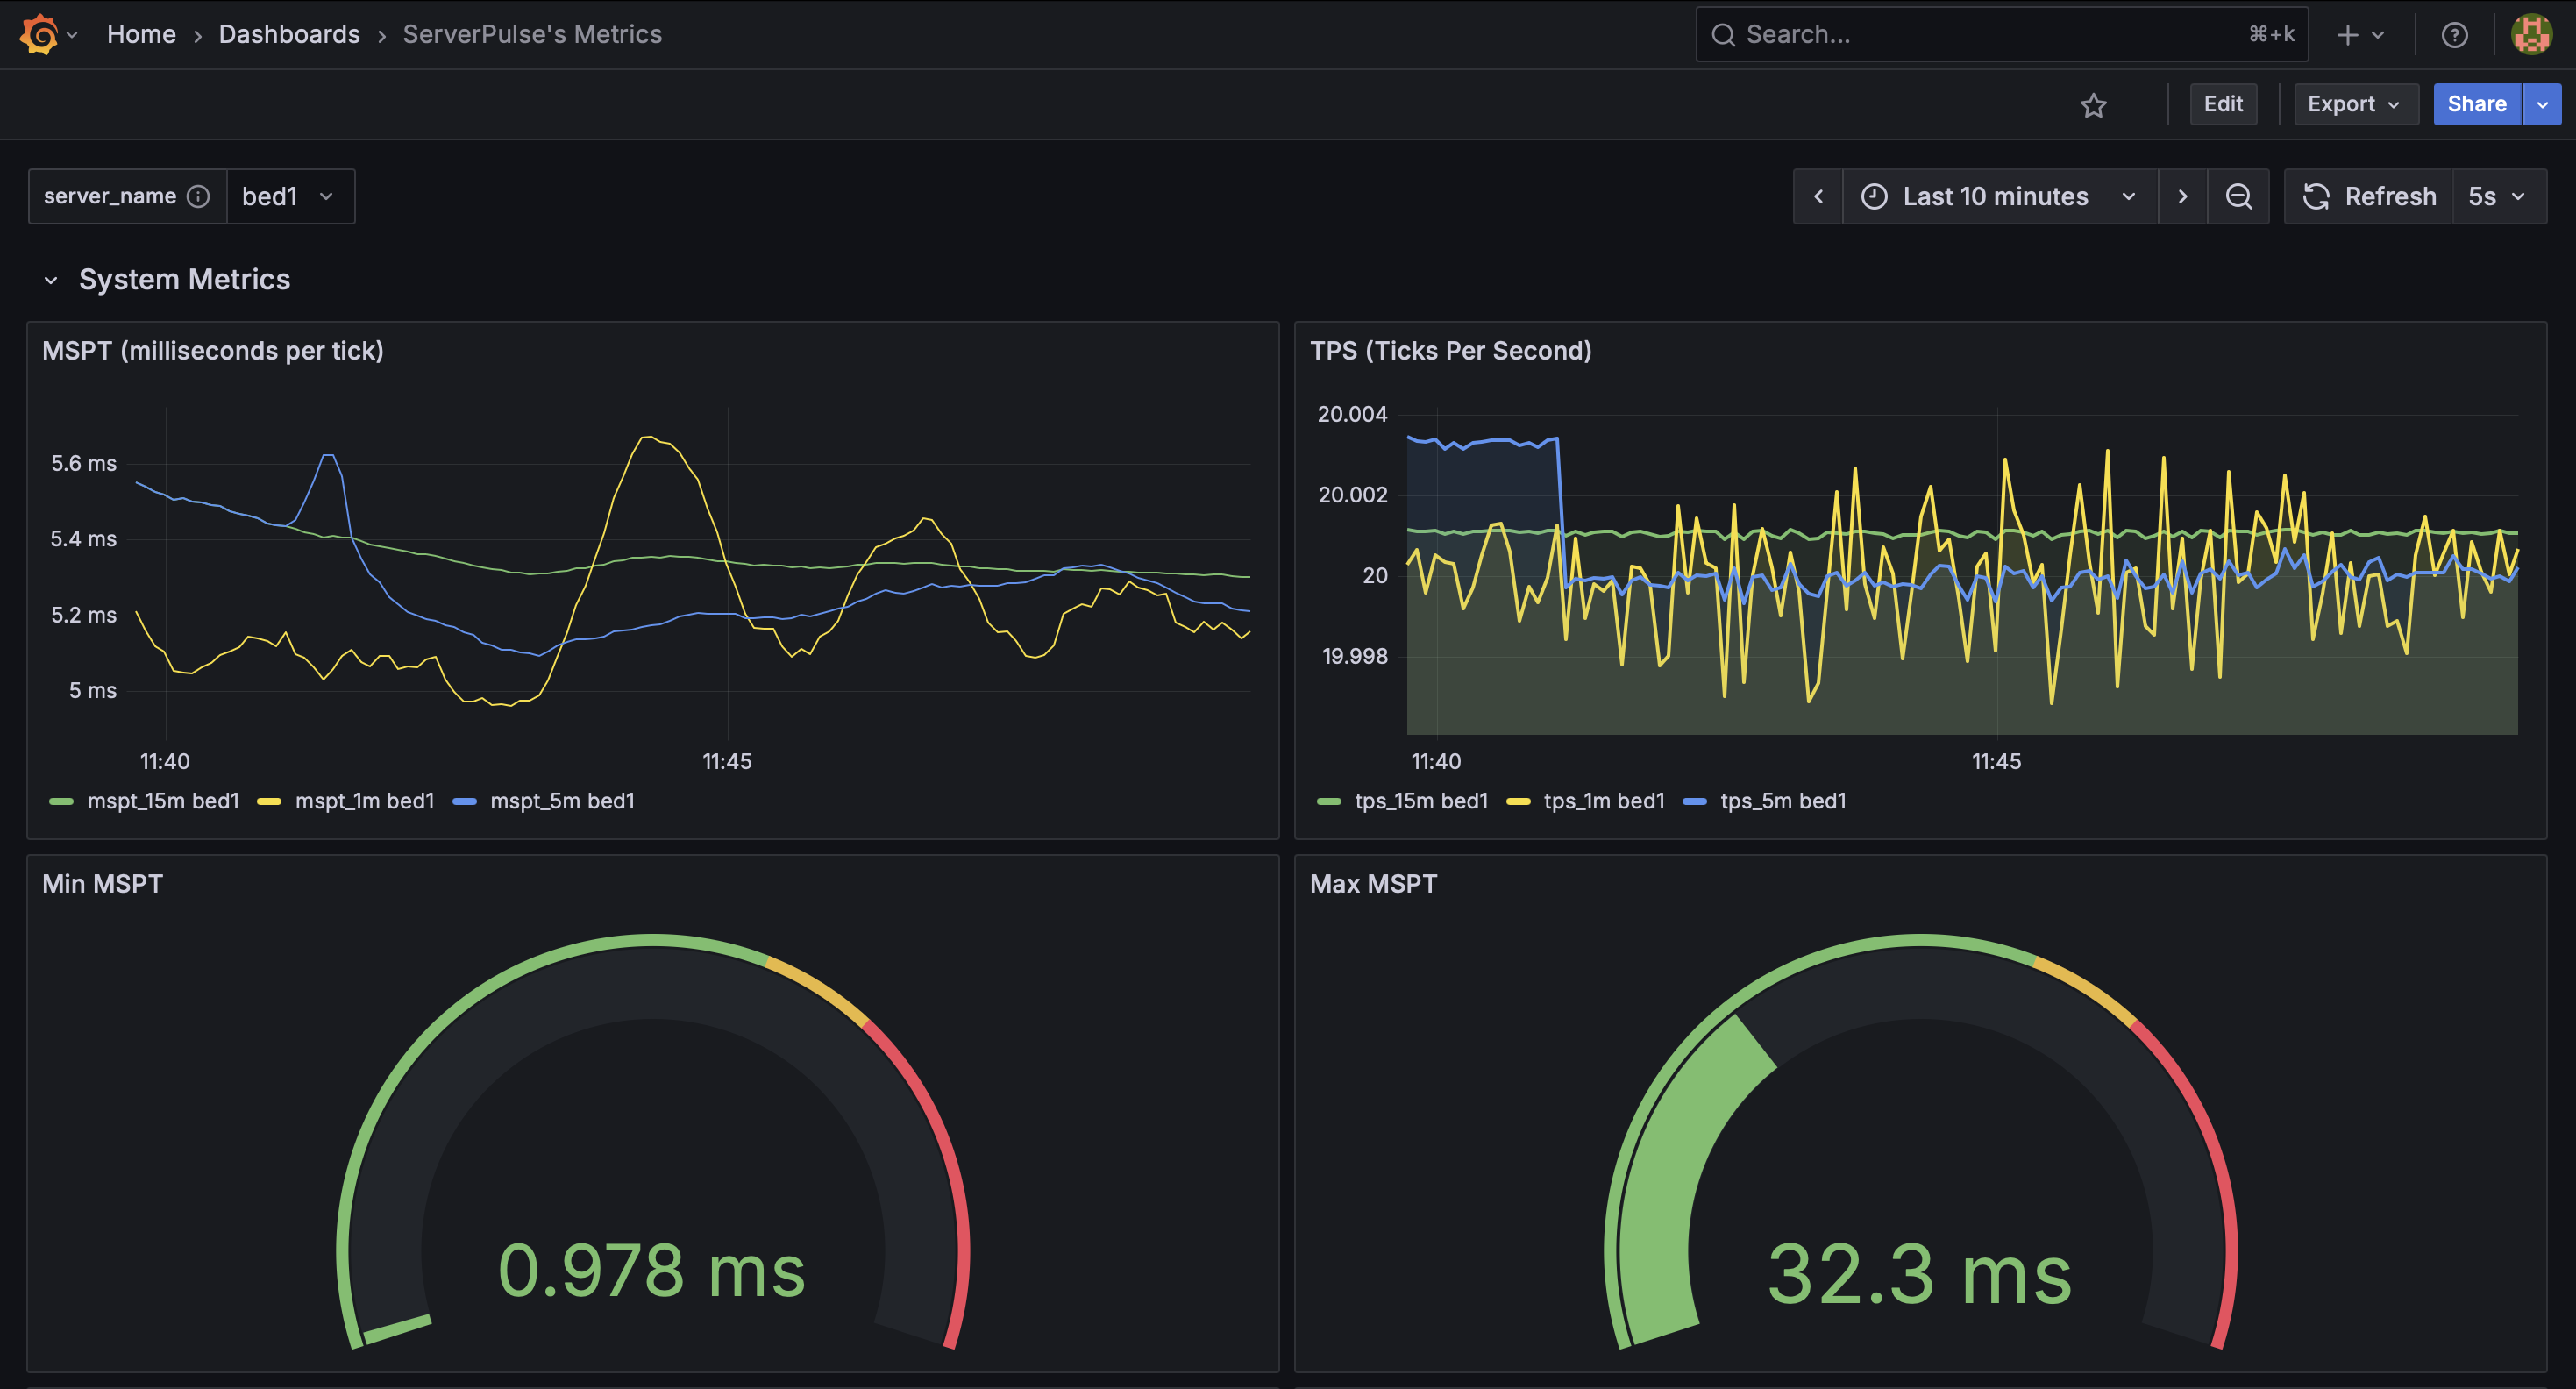
_Example dashboard view 1: System Metrics_
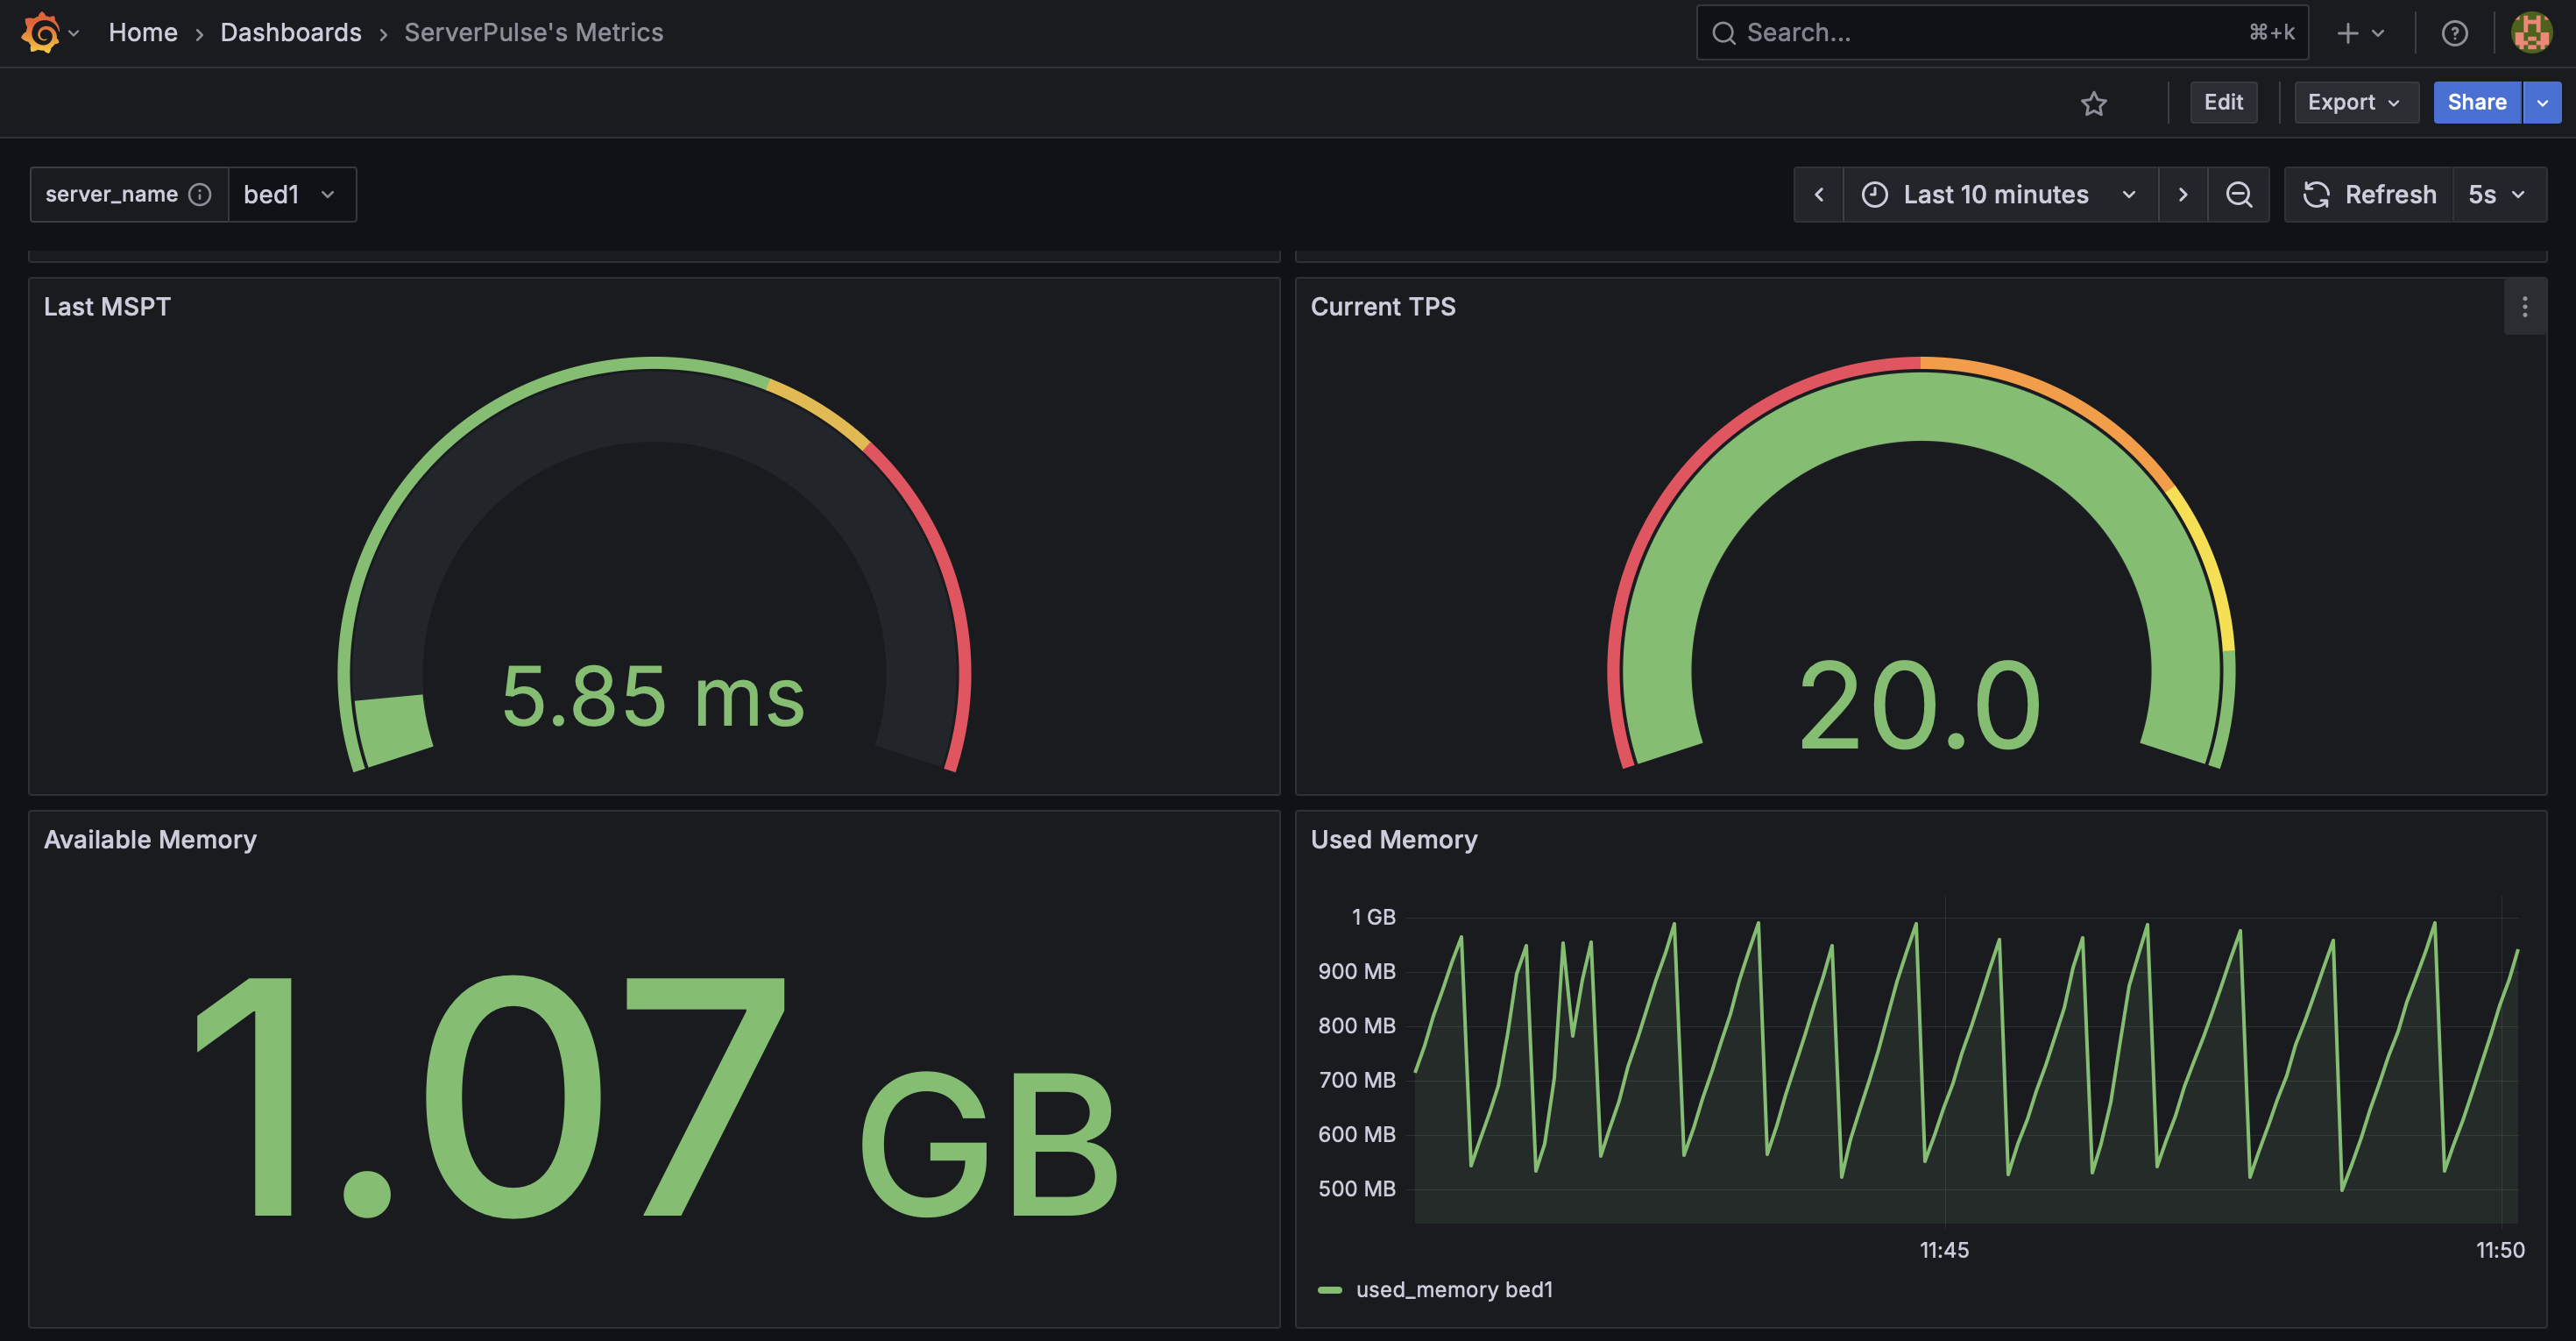
_Example dashboard view 2: System Metrics 2_
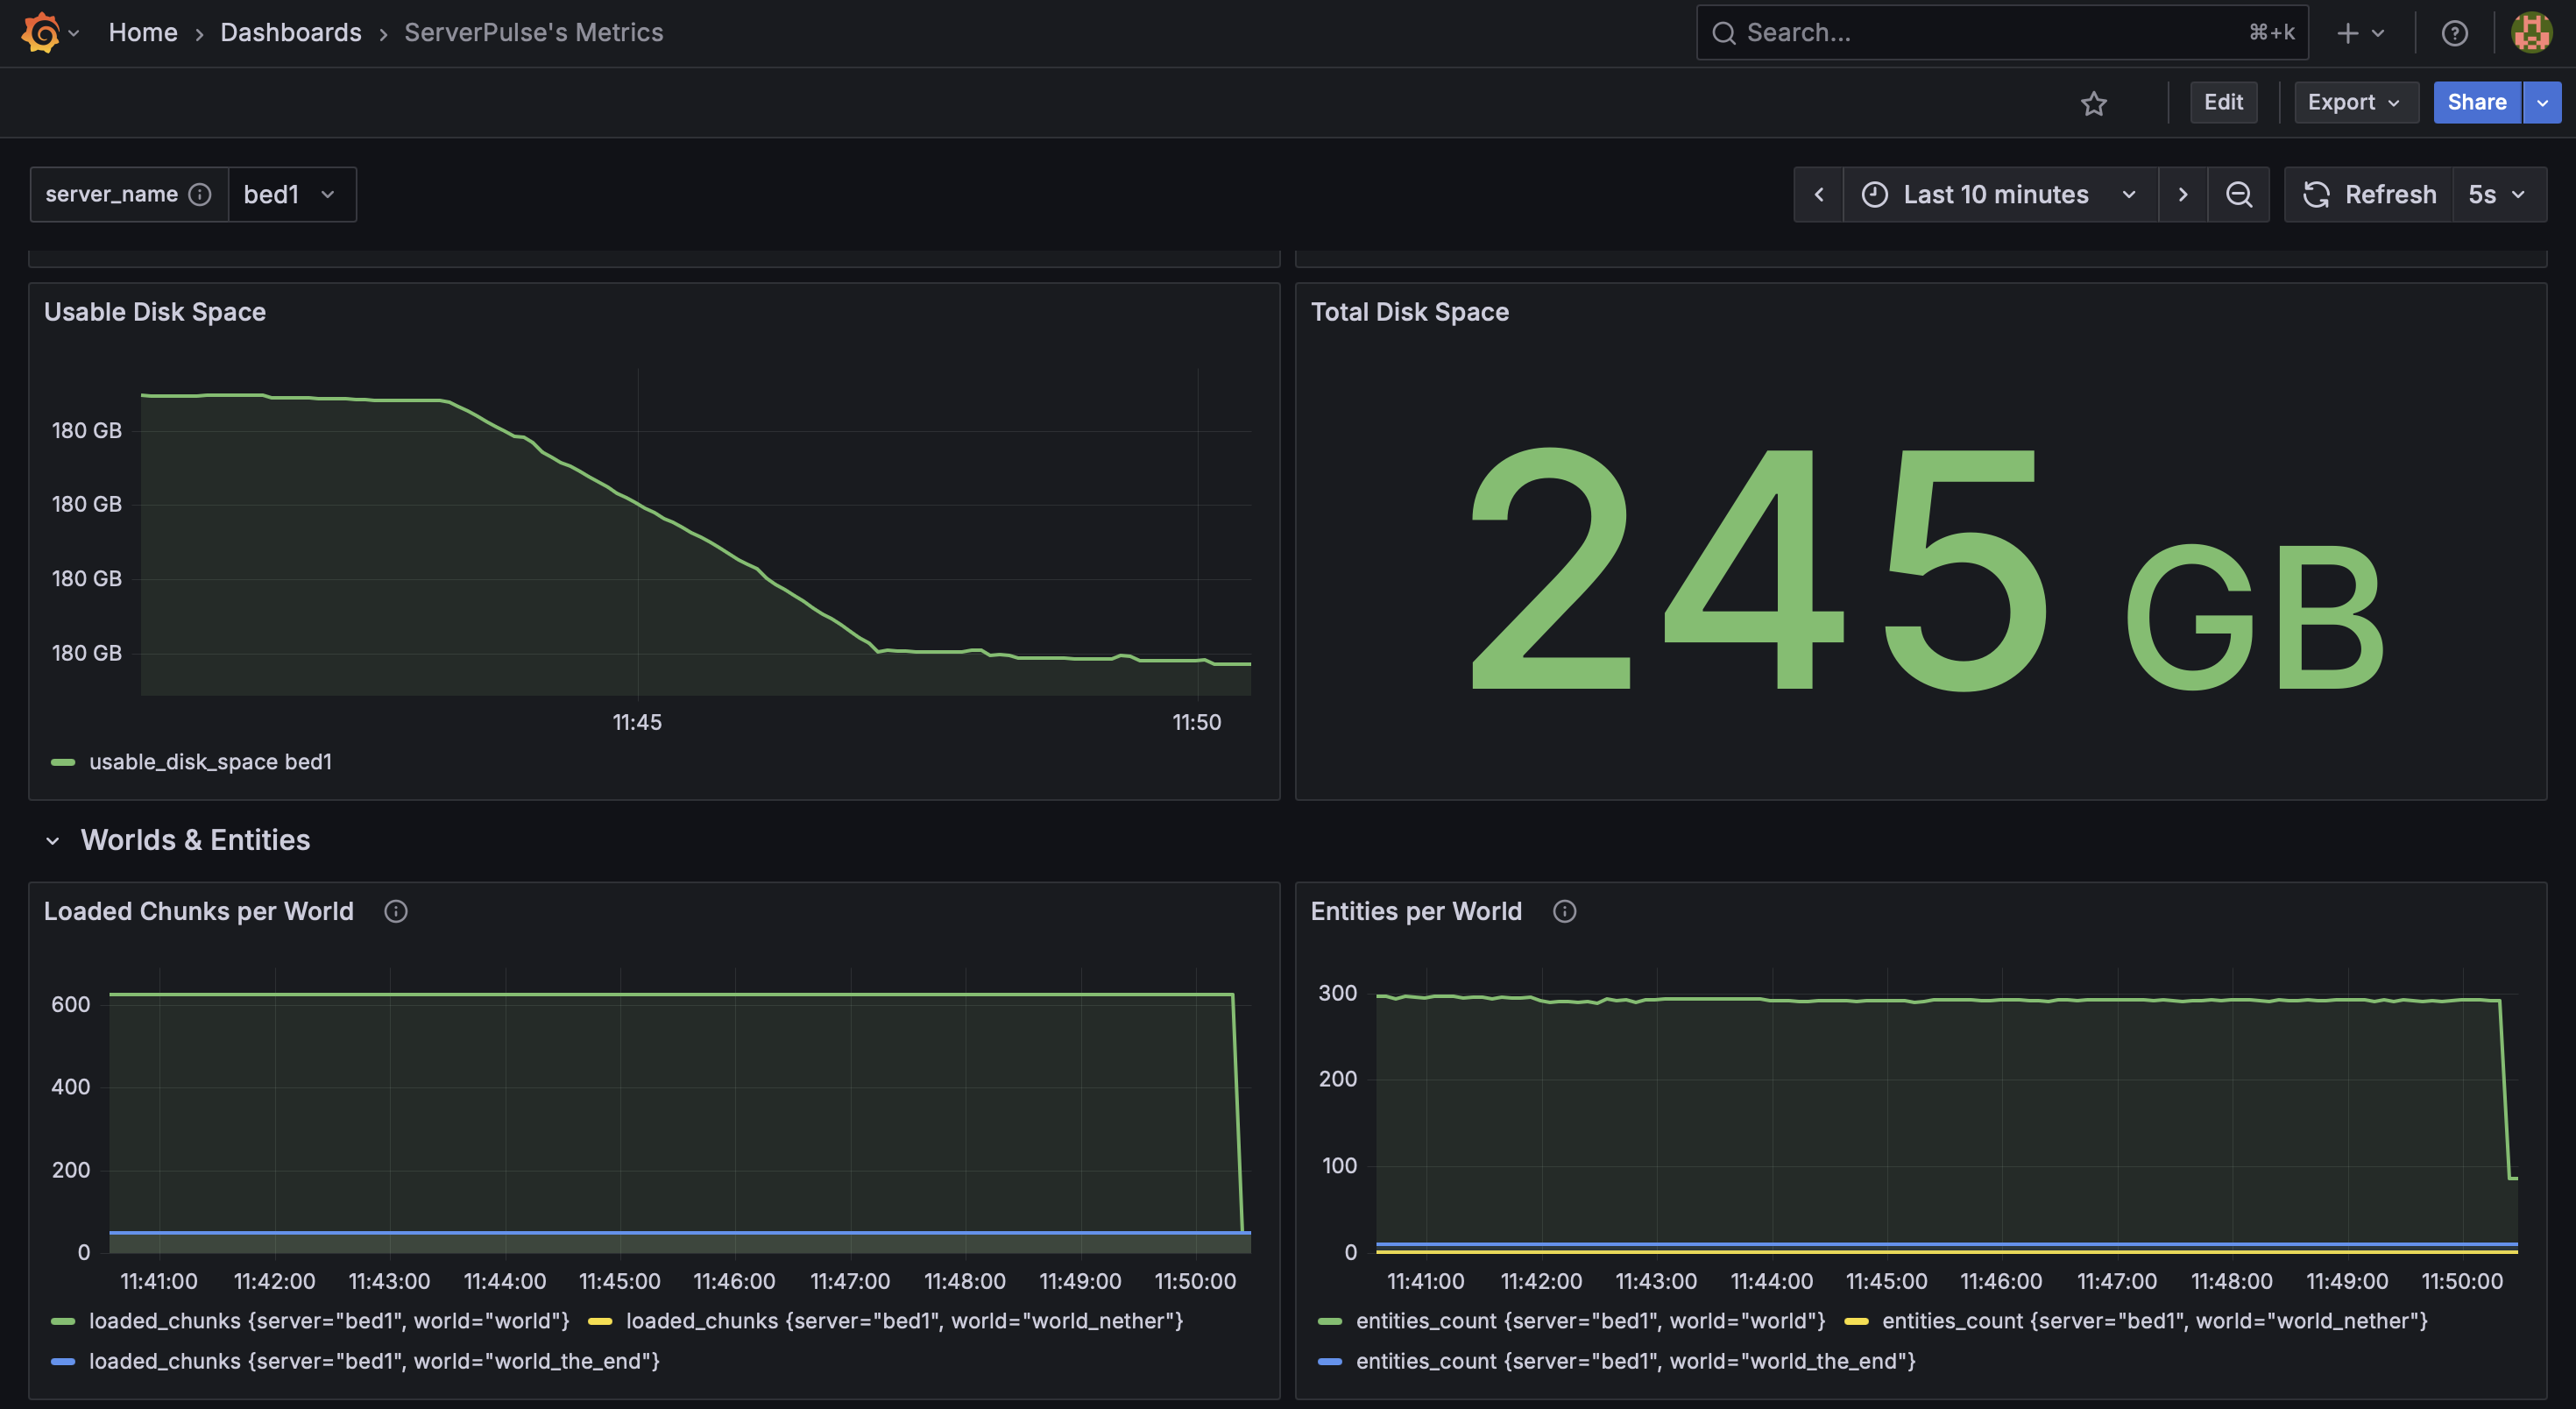
_Example dashboard view 3: System & World Metrics_
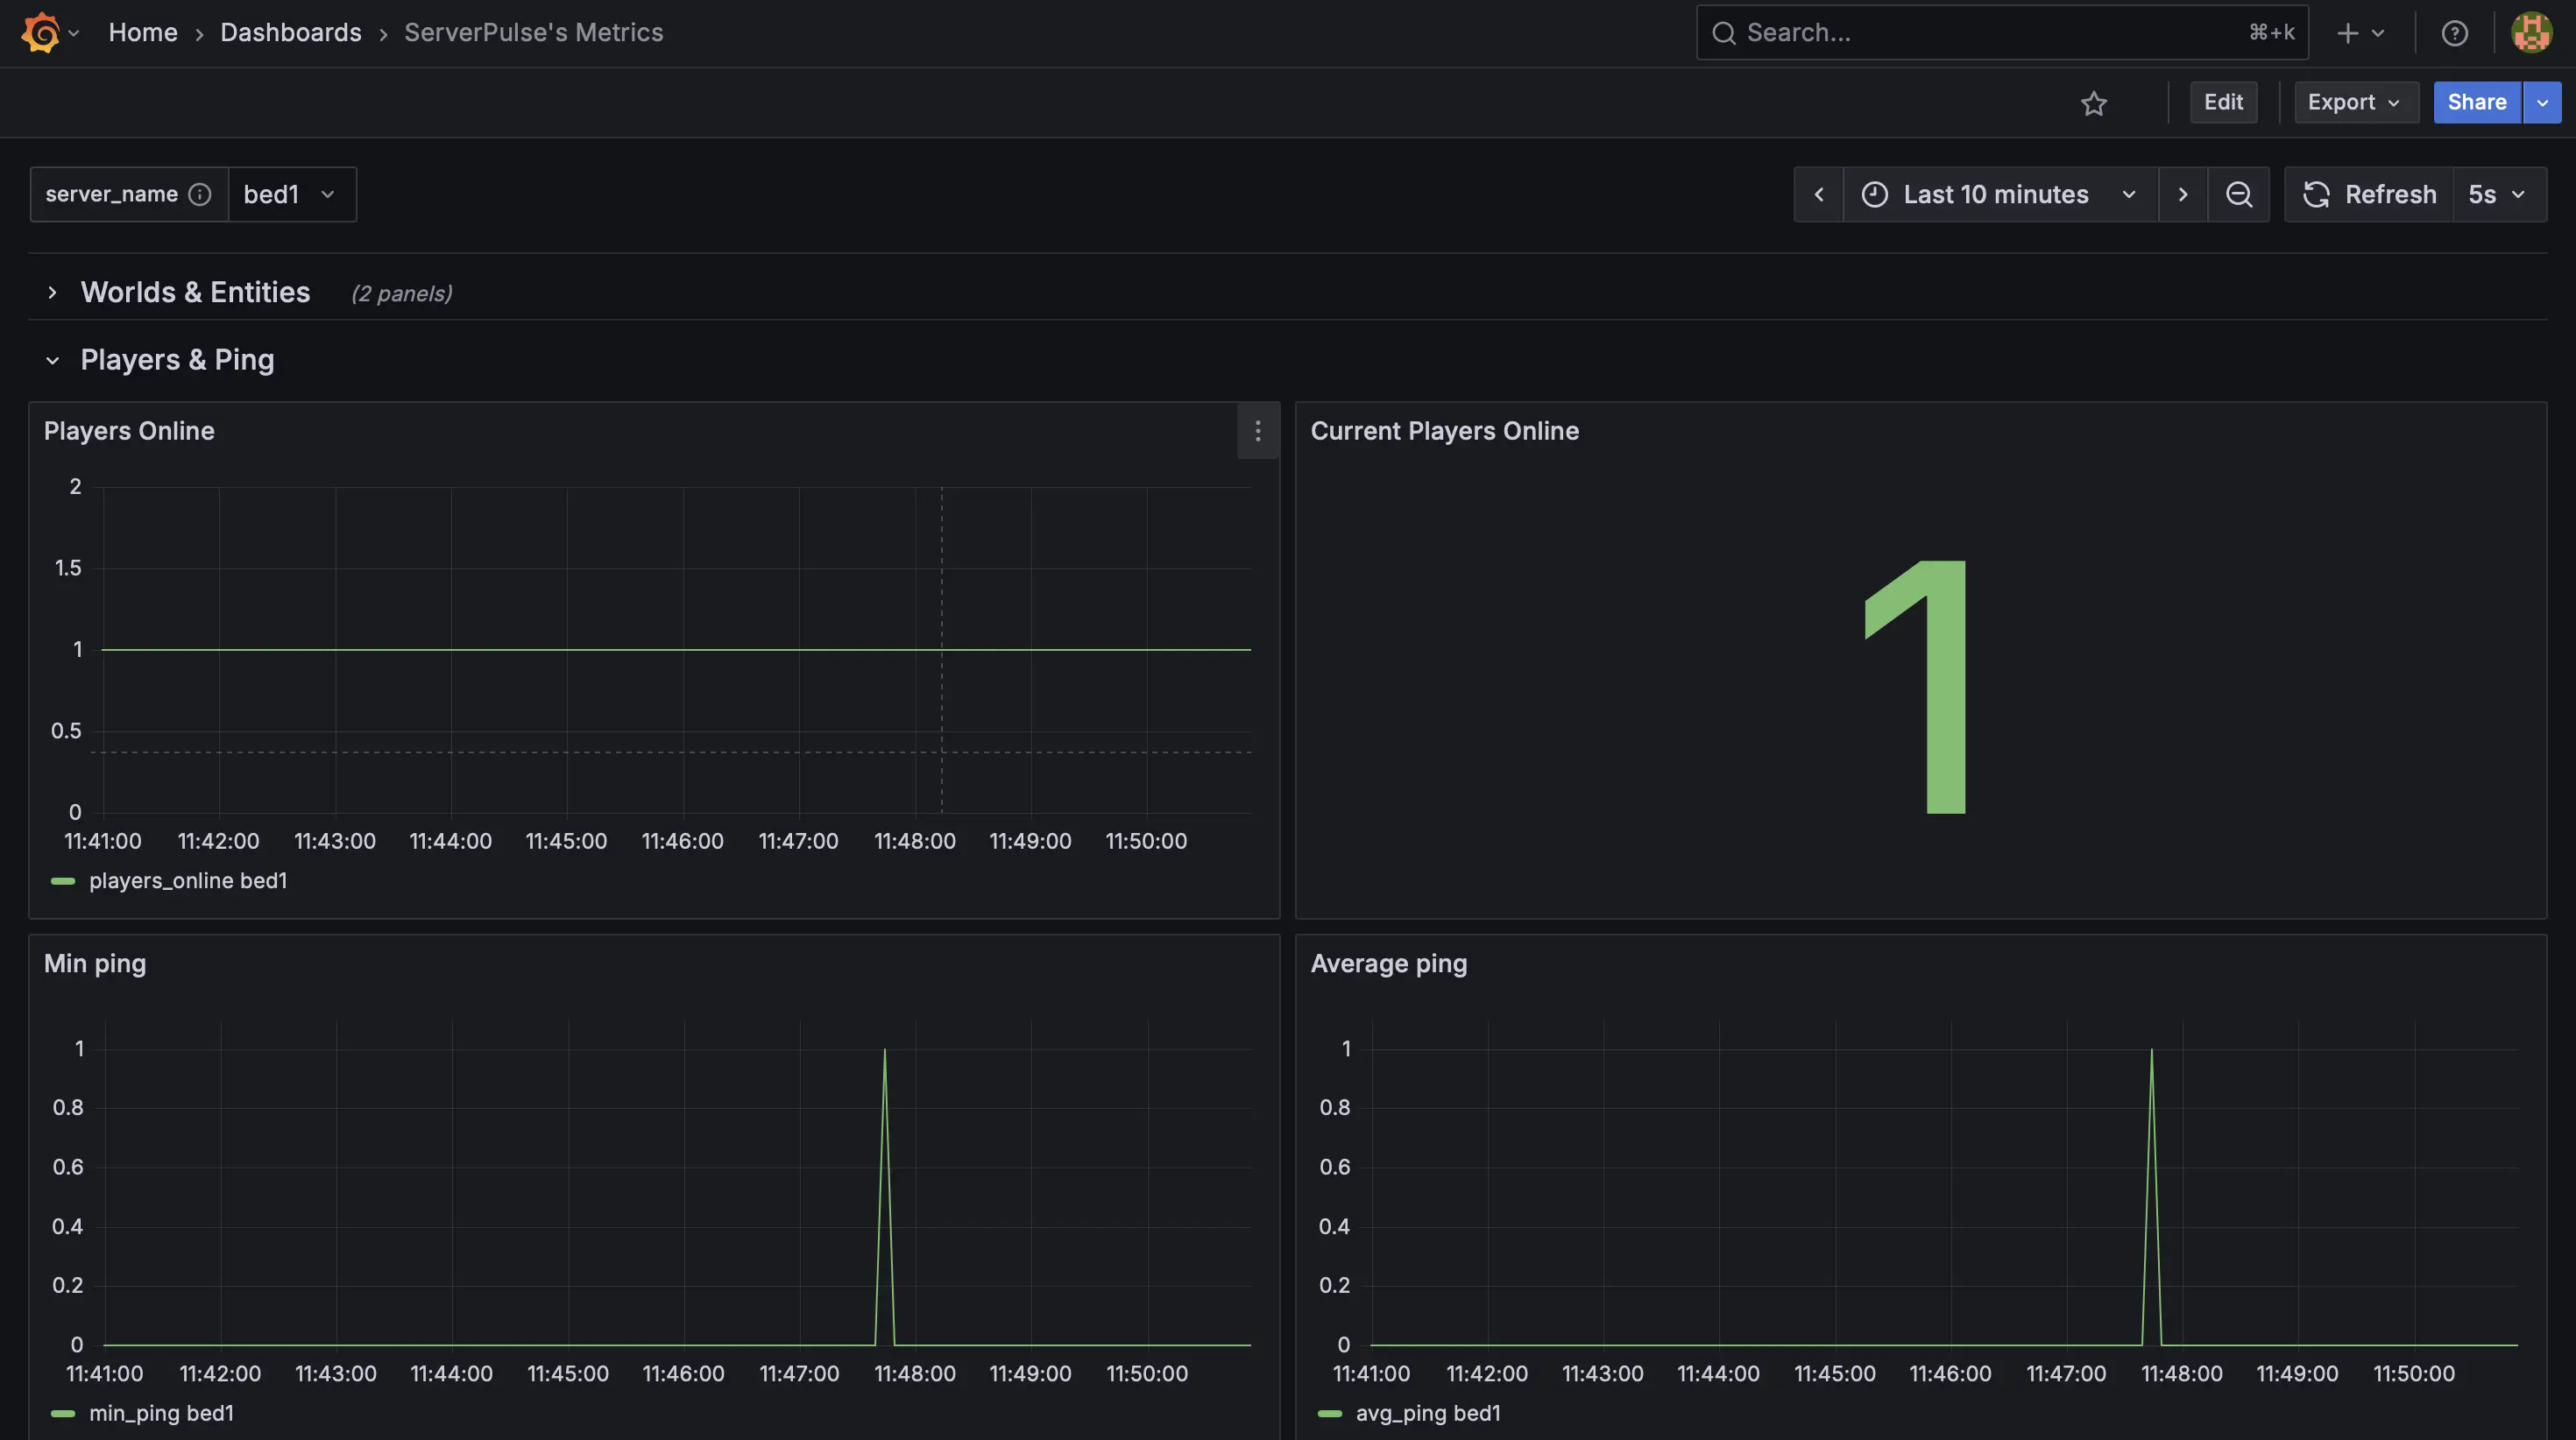
_Example dashboard view 4: Player Metrics_
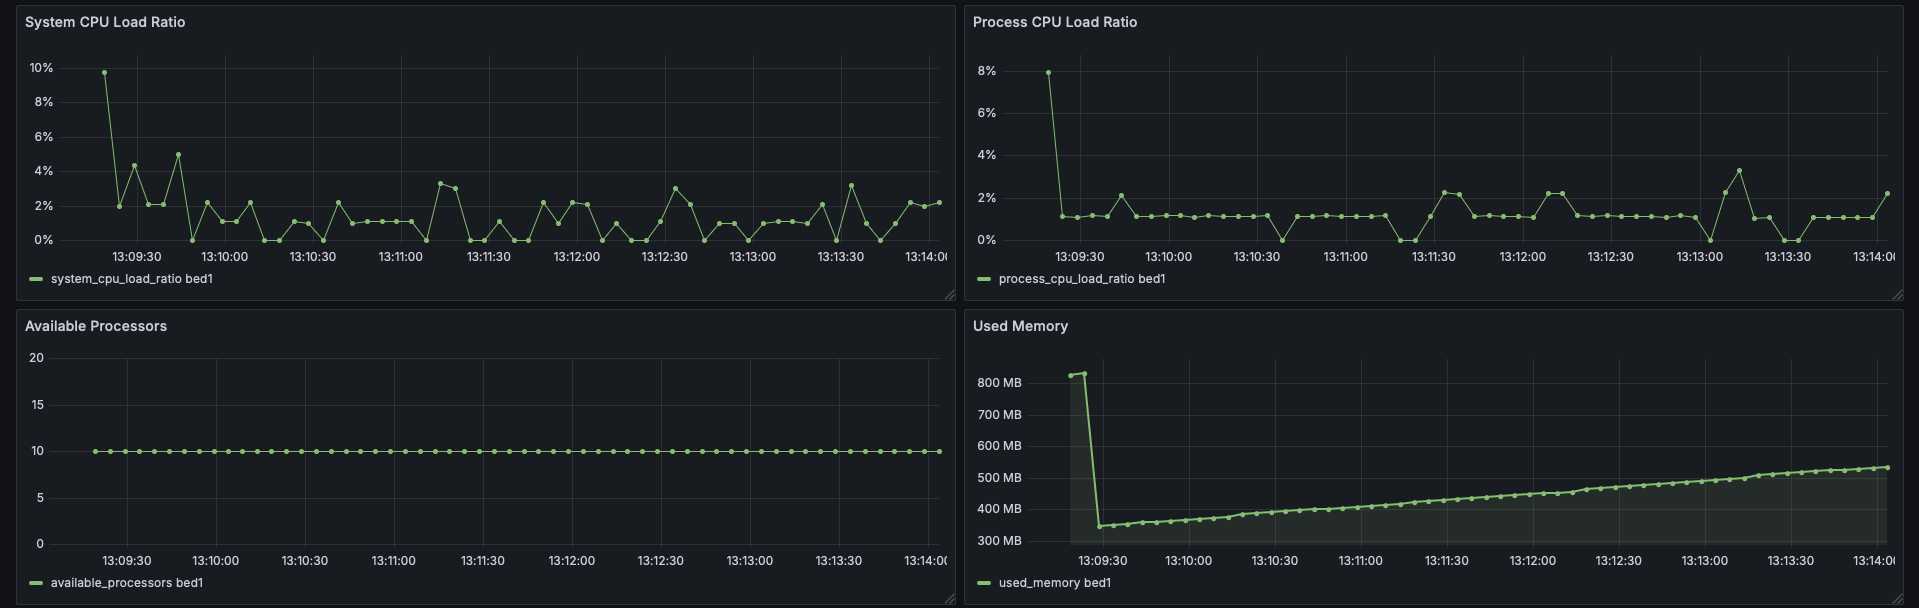
_Example dashboard view 5: CPU Stats_
## Support & Contributions:
- Issues & Features [https://github.com/renvins/serverpulse/issues](https://github.com/renvins/serverpulse/issues)
- Contributing [https://github.com/renvins/serverpulse/blob/master/CONTRIBUTING.md](https://github.com/renvins/serverpulse/blob/master/CONTRIBUTING.md)
- Discord [https://discord.gg/jZUqcemc4G](https://discord.gg/jZUqcemc4G)
**Ready to take control of your server's performance with a professional monitoring solution? Download ServerPulse today!**